|
1. What Are Value Stream Mapping Symbols VSM utilizes industry-recognized value stream symbols to map out all the processes from raw material to finished product. It is a graphical representation of the manufacturing process by including all stakeholders, processes, information, and materials in a flowchart. VSM symbols are best suited for visualizing production process design through the principles of process improvement. Different departments that use value stream mapping are manufacturing, logistics, supply chain management, IT services, software development, and HR.
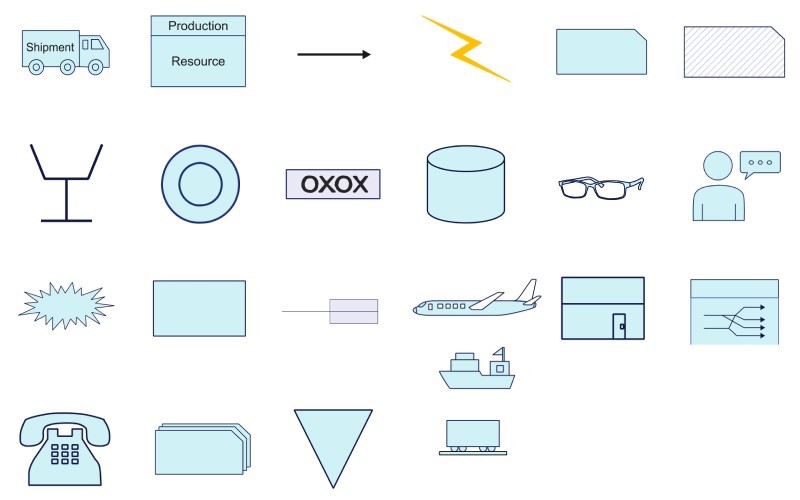
2. Value Stream Mapping Symbols Explained Lean Enterprise Institute introduced many recognized symbols in the book "Learning to See," in 2009. Though VSM symbols are not an exhaustive list, you can add your symbols based on your requirement. However, the team must be on the same page about the newly introduced symbols. Value stream mapping symbols are categorized as; - Process VSM symbols
- Material VSM symbols
- Informational VSM symbols
- General symbols
2.1 Process Symbols Value stream mapping icons and symbols that are used to visualize part of the process to identify waste of resources are called process symbols. Process symbols are related to the working and functions of different processes like manufacturing, supply chain, HR, etc. A brief introduction to process symbols is given in the following table.
| Symbol | Name | Description |
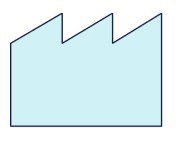
| Customer/Supplier Icon |
The customer or supplier icon represents two different elements based on the placement.
It represents the supplier if it is placed in the upper left corner of a value stream map.
When it is placed in the upper right corner, it represents the customer. |
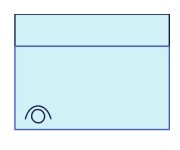
| Dedicated process flow icon | This Value stream mapping symbol represents fixed and continuous internal material flow through a department, process, operation, or machine. |
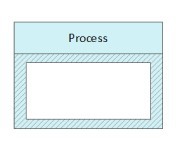
| Shared process icon | This VSM symbol represents a process, department, operation, or work center shared by other value stream families. |
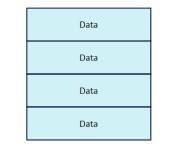
| Databox icon | The data box icon represents the significant data. It is usually placed under other symbols that own this data. It can be input material used in one day, the quantity of waste or shipping frequency, etc. |
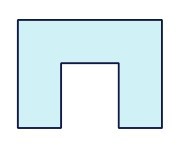
| Workcell icon | The work cell icon shows an integration of multiple processes into one manufacturing work cell. |
2.2 Material Symbols Material value stream mapping symbols include symbols of everything related to Inventory and materials. It includes raw materials, inventories, and the operations related to them. Let us see them one by one now.
| Symbol | Name | Description |
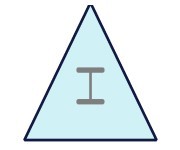
| Inventory Symbol | This inventory Value stream mapping icon can show Inventory between two processes and stored Inventory. Add the inventory count below this triangle, if required. |

| Shipment Symbol | Shipment represents the shifting of procured raw materials from the supplier to the plant. It also shows the delivery of finished products from the manufacturer to the customer. |
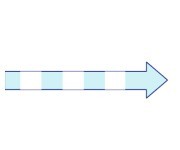
| Push Arrow | Push arrow VSM symbol is used to represent the journey of material from one process to another. It is mostly used in manufacturing. |

| Supermarket | It is also known as a Kanban stock point. It shows where downstream customers can get the Inventory they need as the supplier provides it. |
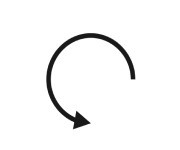
| Material Pull | It is used when supermarkets connect to downstream processes to remove the materials from the supermarket physically. |
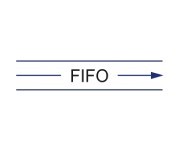
| FIFO Lane | Represents a First-In-First-Out inventory system. The maximum limit of input 'MAX' is written under the line. |

| Safety Stock | It is the emergency stock that is used to protect the system in case of system failures. |
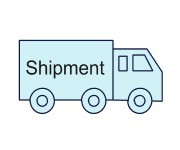
| External Shipment | External shipment is a shipment of raw materials from the supplier or delivery of products to the customer. |
2.3 Information Symbols
| Symbol | Name | Description |
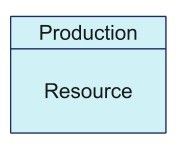
| Production Control | Production control represents a central production scheduling or control department. |
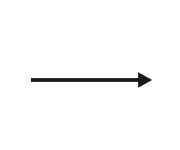
| Manual Info | Manual info is the flow of general information from memos, reports, etc. |

| Electronic info icon | The electronic info icon shows the digital information flow such as the Internet, Intranets, LANs, WANs, etc. |
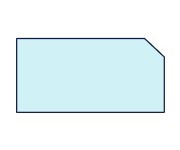
| Production Kanban | Production kanban represents the production needed to supply parts to customers. |
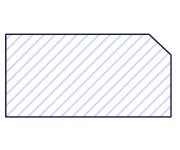
| Withdrawal Kanban | It represents a card that instructs the operator to move parts from a supermarket to a process. |
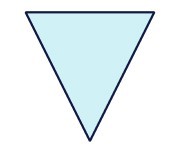
| Signal Kanban | The Signal Kanban symbol represents that inventory levels in a supermarket have dropped to a minimum. Eventually, it signals the production for the receiving process. |
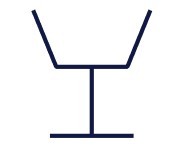
| Kanban Post | Kanban posts are used near supermarkets to show a location for collecting Kanban signals. |

| Sequenced pull icon | Represents a pull system that offers instructions to processes to manufacture a required product. It eliminates the need for supermarket storage. |
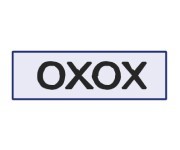
| Load leveling icon | The load leveling icon is used to batch Kanbans to level the production volume. |
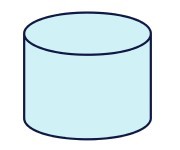
| MRP/ ERP | Material requirements planning (MRP) is an inventory scheduling symbol. |

| Go See | It is used when visual observation by the supervisor is required. |

| Verbal information | Verbal and personal information flow. |
2.4 General Symbols
| Symbol | Name | Description |

| Kaizen burst icon | The Kaizen burst icon highlights the problem areas. It is a short burst of activity to solve a problem with intensity and urgency. |
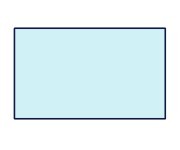
| Other information icon | Useful Information |
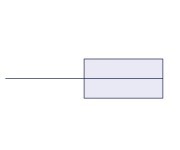
| Timeline Symbol | The timeline shows waiting times and processing times. It also helps calculation of lead time and total cycle time. |
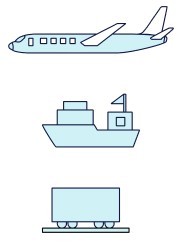
| Transportation Symbol | This is a group of symbols showing the type of transportation. Such as trains, airplanes, boats, or ships. |
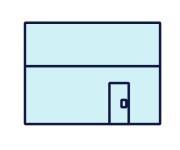
| Warehouse Symbol | Internal or external warehouse. |
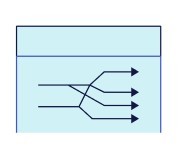
| Cross-Dock Symbol | Shows the supply chain that eliminates the need for a warehouse. The materials go directly from inbound to outbound trucks. |

| Phone | Communication by phone or even phone orders. |
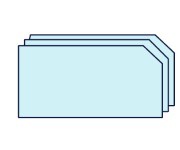
| Batched Kanban | Kanban cards arriving or being sent in batches. |
|