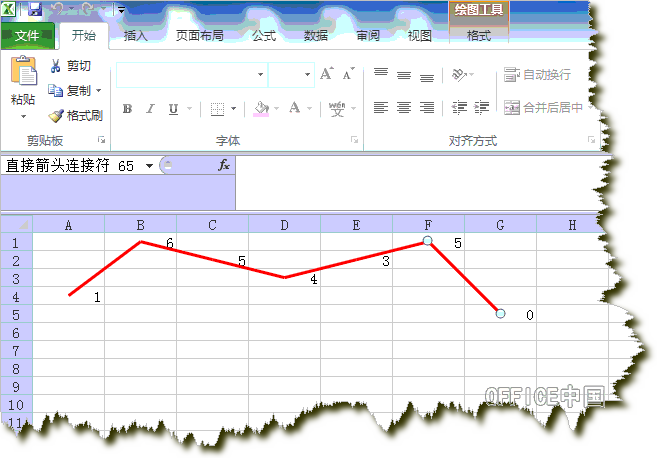
Excel如何在单元格内显示图表(折线图)Excel的图表是非常强大的,但很少有人在单元格内放置图表,而且图表对象也是比较重。但不用图表对象,能否实现折线图呢就有这些Excel强人,硬生生地给实现了。看看他们是如何做到的
作者:Excel小子
1479389278122885.png

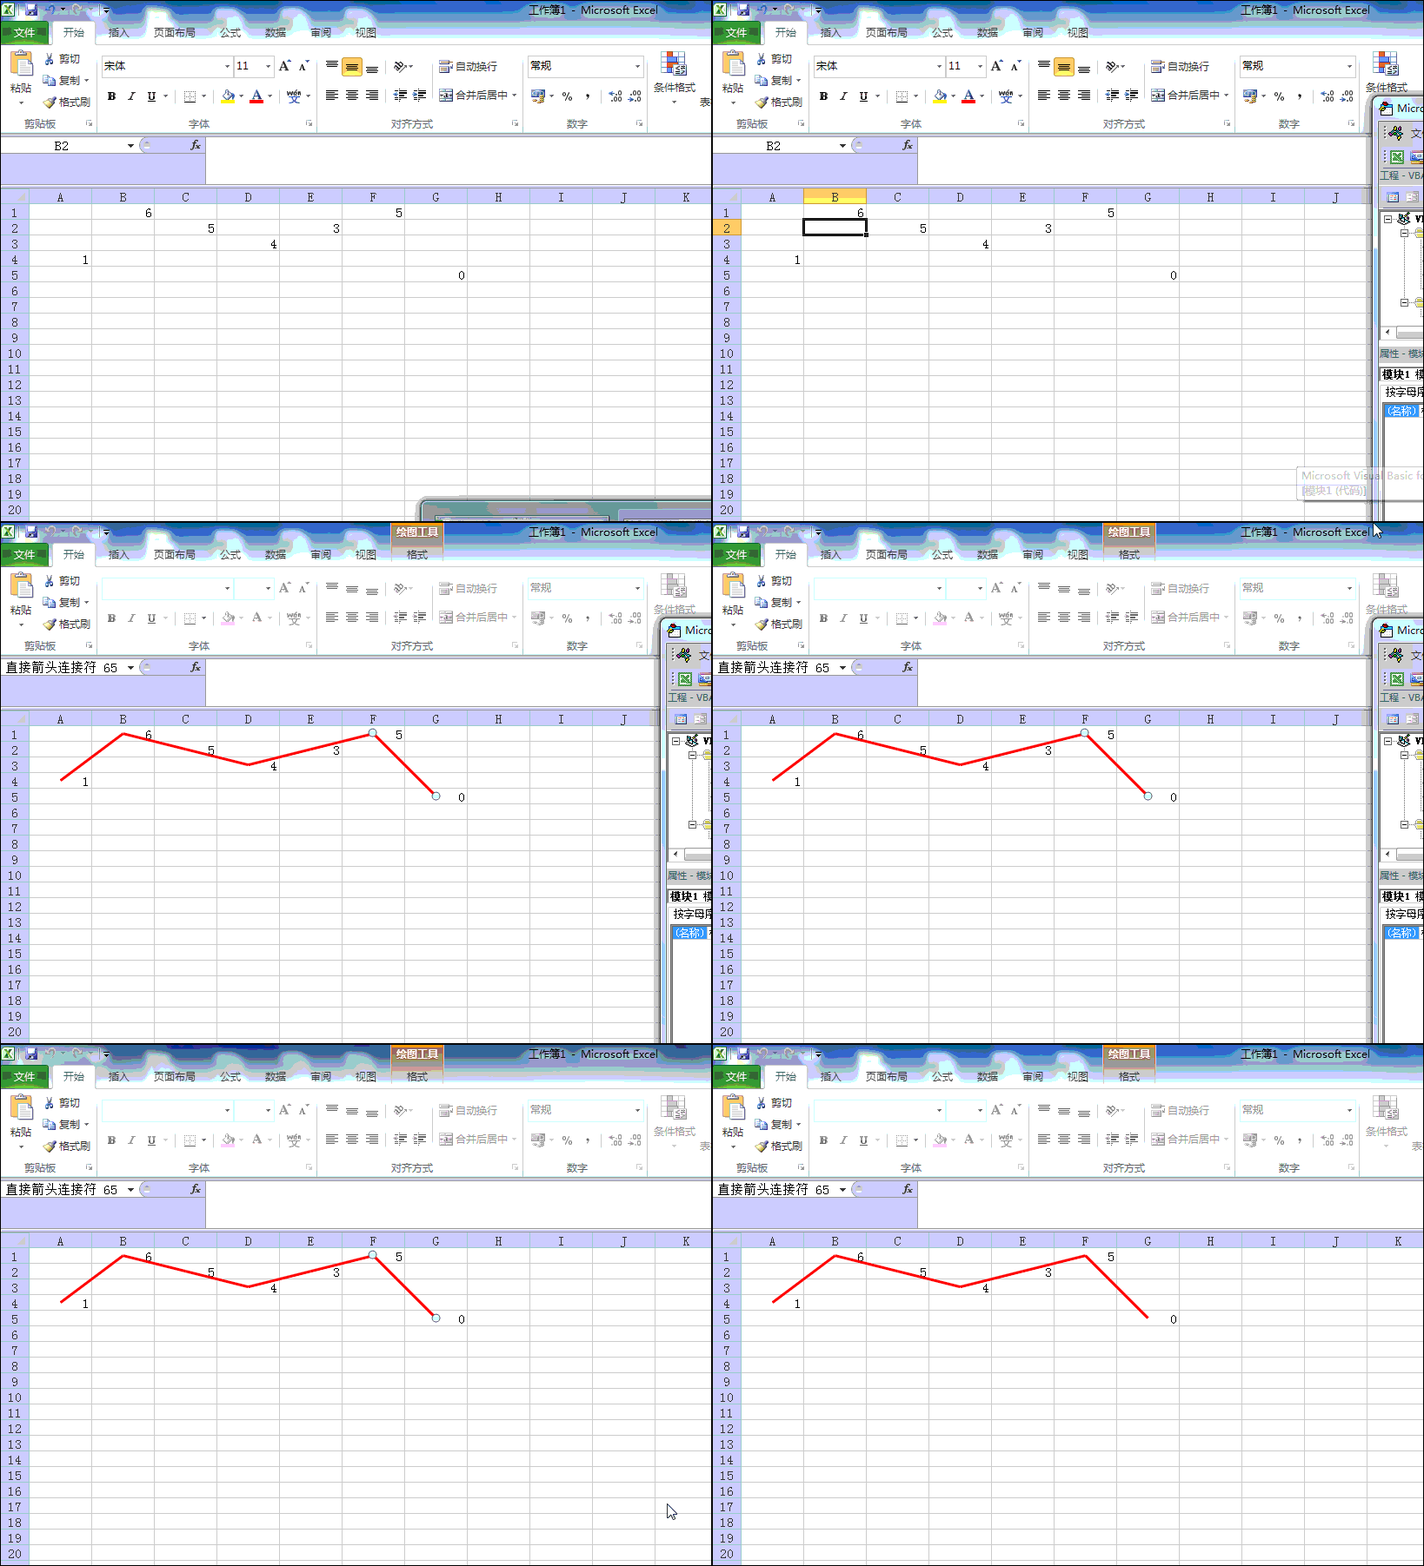
操作动画:
1479389537360176.gif

实现代码:Sub 宏3() ' ' 宏3 宏 '
'Dim sh As Shape, t, qDim rg As Range, r As Range, rr As Range, iFor Each sh In ActiveSheet.Shapes sh.DeleteNext sh
For t = 1 To Range("a1").CurrentRegion.Columns.Count For q = 1 To Range("a1").CurrentRegion.Rows.Count Set rg = Cells(q, t)If Len(rg.Value) > 0 Then
i = i + 1If i = 1 Then Set r = rgElse ActiveSheet.Shapes.AddConnector(msoConnectorStraight, r.Left + r.Width / 2, r.Top + r.Height / 2, rg.Left + rg.Width / 2, _ rg.Top + rg.Height / 2).Select With Selection.ShapeRange.Line .Visible = msoTrue .ForeColor.RGB = RGB(255, 0, 0) .Transparency = 0 End With With Selection.ShapeRange.Line .Visible = msoTrue .Weight = 2.25 End With Set r = rg End If End IfNext qNext t
End Sub
作者:江苏大侠
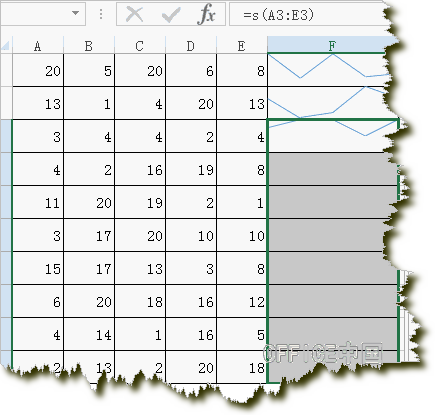
1479389416131681.png

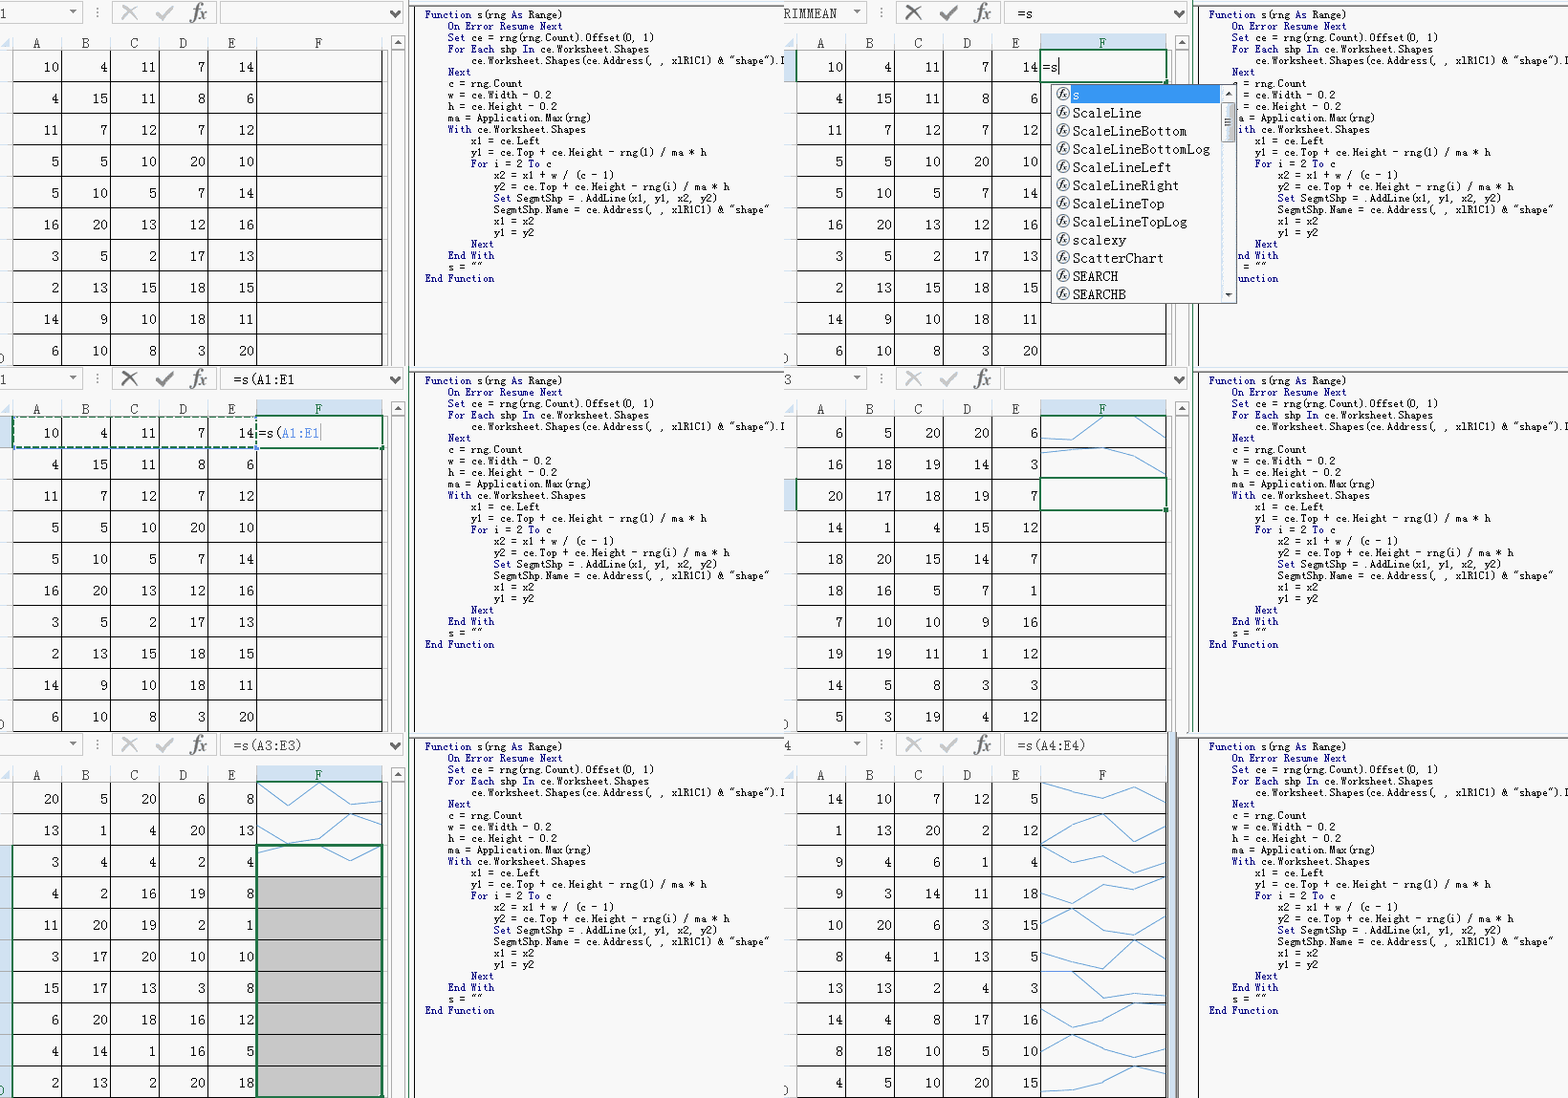
演示动画:
1479389499846435.gif

实现 代码:Function s(rng As Range) On Error Resume Next Set ce = rng(rng.Count).Offset(0, 1) For Each Shp In ce.Worksheet.Shapes ce.Worksheet.Shapes(ce.Address(, , xlR1C1) & "shape").Delete Next c = rng.Count w = ce.Width - 0.2 h = ce.Height - 0.2 ma = Application.Max(rng) With ce.Worksheet.Shapes x1 = ce.Left y1 = ce.Top + ce.Height - rng(1) / ma * h For i = 2 To c x2 = x1 + w / (c - 1) y2 = ce.Top + ce.Height - rng(i) / ma * h Set Shp = .AddLine(x1, y1, x2, y2) Shp.Name = ce.Address(, , xlR1C1) & "shape" x1 = x2 y1 = y2 Next End With s = ""End Function |